A tool for testing your own prediction models. It doesn't give you advice and it doesn't sell you signals. It tells you whether what you built is real — including when the answer is no.
Buy — $19One-time purchase · 30-day refund, no questions · macOS
The complete mathematics is published — every formula, and a section on what each check cannot prove: read it or take the PDF.
Every run prints a model card — a plain-language account of how much to trust the result, built from four checks.
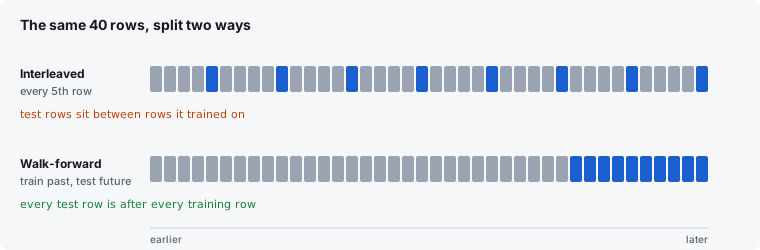
Trains on the early data, tests on the later data, the way you'd actually have to use it. It never learns from anything that would still be in the future.
Retrains the same engine on deliberately shuffled targets. If your real data can't beat scrambled data, there's nothing there.
Which inputs actually carry the result, measured by breaking one at a time.
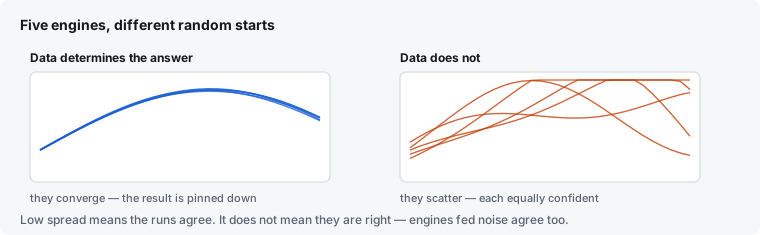
Five engines from different random starts. Where the data determines the answer they converge; where it doesn't, they scatter — and each one sounds just as confident.
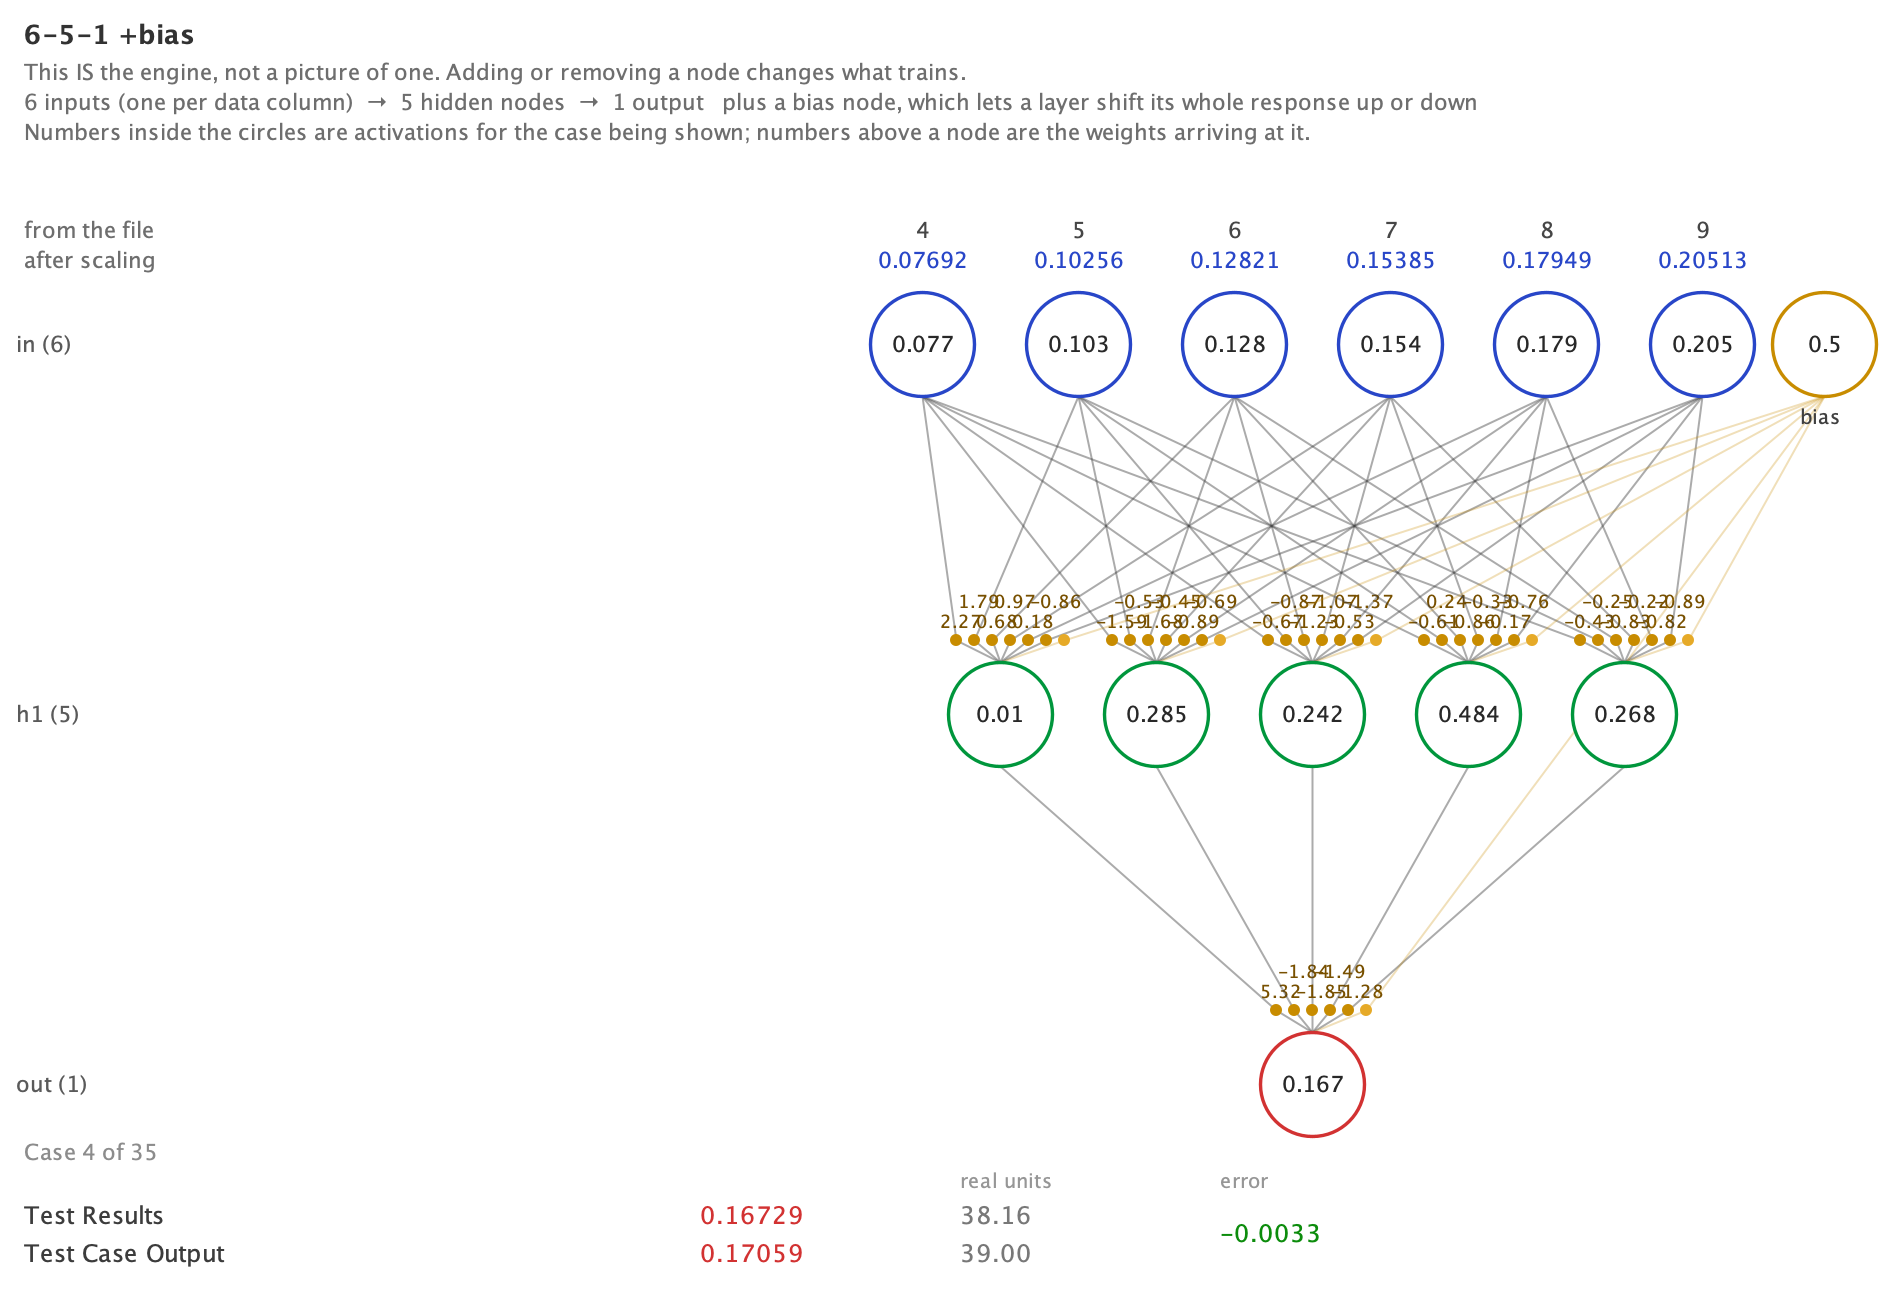
This is the engine itself, not a picture of one — rendered by the same drawing code the application runs. A six-input network with five hidden nodes, trained on a file that ships with the software.
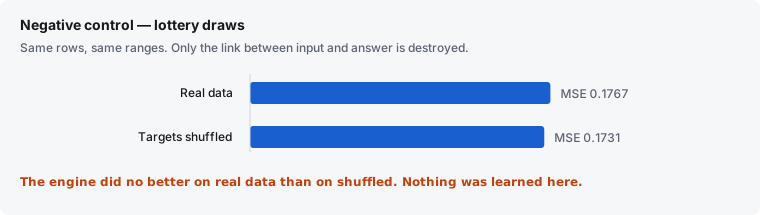
I ran lottery draws through it, because I already knew there was nothing to find. The negative control settles it: the engine scores the same on real draws as on draws with the answers shuffled, and the model card says so in plain words — nothing was learned here.
Then a series with lag features, scored two ways. This is the actual output, from a file that ships with the software:
$ DetectBS --auto --leak-check --in data/leak_demo.csv

LEAK CHECK
  Same data, same shape, scored two ways.

  interleaved split (every 5th row)            1.3518
  walk-forward (train past, test future)       1.5872
  guessing the mean                            8.0085
  (mean absolute error, averaged over the outputs -- lower is better)

  the interleaved split looked 17.4% better than the honest one

  That gap is the leak. An interleaved split trains on rows either side
  of the ones it is tested on, and with lag features those carry nearly
  the same numbers. Any result you have scored that way is inflated by
  roughly this much.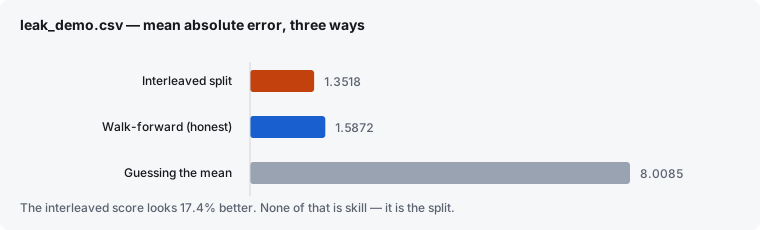
Same engine. Same file. The only thing that changed was scoring it honestly.
Both files ship with the software, so you can reproduce either one in a single command. That's the point: if the checks can't catch a case where the answer is certain, they can't be trusted on a case where it isn't.
Every calculation the software performs is published. Here are three of them, because they are the whole argument.
Walk-forward means one thing. Whatever the fold arithmetic, every split has to satisfy a single condition:
$$\max(\text{training time}) \;<\; \min(\text{test time})$$That is the formal statement of no future data in the training set. A split that violates it is not a stricter test with a worse score — it is measuring a different quantity.
The leak indicator scores the same file both ways and reports the difference between the honest error and the flattering one:
$$G = 100\,\frac{e_{\mathrm{wf}} - e_{\mathrm{int}}}{\max(\varepsilon,\ |e_{\mathrm{int}}|)}$$For the run above, \(e_{\mathrm{int}} = 1.3518\) and \(e_{\mathrm{wf}} = 1.5872\), so \(G \approx 17.4\%\). None of that 17.4% is skill.
The negative control retrains the identical network on the same rows with the targets permuted, so every real relationship is destroyed and every structural property survives:
$$\mathcal{D}_{\mathrm{shuffled}} = \left\{\left(\mathbf{x}_i,\ \mathbf{y}_{\pi(i)}\right)\right\}_{i=1}^{N}$$A necessary — but not sufficient — condition for having learned anything is \(E_{\mathrm{real}} < E_{\mathrm{shuffle}}\). On lottery draws, the engine scores \(1.767\times10^{-1}\) on real data and \(1.731\times10^{-1}\) on shuffled. It failed, and it says so.
The full document derives the network, the training rule, the capacity budget and every check. Section 9 states what none of this can establish — that the leak indicator and the negative control are both one-sided, that ensemble agreement measures determinacy rather than accuracy, and that
$$\text{Passing all checks} \;\not\Rightarrow\; \text{future correctness.}$$Read The Mathematics · download the typeset PDF
The Illustrated Guide is a free companion edition. It covers every idea above — leakage, negative controls, capacity limits, ensemble agreement, and what none of them can prove — in plain language, with a picture drawn for each one and a foldout flowchart of every question the software asks about a dataset. No mathematics, no purchase, nothing to install. If you need to explain to somebody else why a model that scores well might still be worthless, start here.
Read The Illustrated Guide · download it as a PDF
--auto shape search with the full model card--leak-check to score the same file honestly and dishonestly, and show the gap--ticker for a single series through time, scored against the naive baseline--stream prequential mode: predict first, then learn from the answerIt will not tell you what to buy, sell or do. There are no analyst ratings, no consensus targets, no signals folded into the output. Beating a baseline is not the same as making money — costs, spreads, slippage and timing are not in that number.
Prediction is a tool with limited conclusive results. The judgement is yours.
It collects nothing. No analytics, no telemetry, no account, no licence phone-home. Your data never leaves your computer. The only network requests are to Yahoo Finance or FRED, and only when you ask for a feed.
One-time purchase · 30-day refund, no questions · macOS 11 or later, Apple silicon or Intel